


SUMMARY
All environmental radioactivity results received from the Member States Authorities are introduced into the REM database. Compilations of the information received are published by the Commission as monitoring reports.
The aim of these reports is to provide information on low levels of radioactivity in the European environment by making use of standardised reporting levels. These reporting levels are supported by presenting more detailed values of radioactivity levels from a limited number of stations that provide high-sensitivity measurements, the so called “sparse network data”.
Sampling media reported
| Sampling medium | Icon | How samples are taken |
|---|---|---|
| Air |  |
Sampling is carried out by pumping air through filters at a flow rate of several thousand cubic metres per day. |
| Surface water |  |
Samples are either taken continuously or bulked for monthly or quarterly analysis, or alternatively, spot samples are taken periodically several times a year and analysed individually. |
| Drinking water |  |
Samples may be taken from ground or surface water supplies, from water distribution networks, mineral waters, etc. |
| Milk |  |
Samples are generally taken on a monthly basis; but sometimes only during the pasture season. |
| Mixed diet |  |
Samples are taken as ingredients or as complete meals, mostly at places where many meals are consumed (i.e., factory restaurants, schools). |
Dense vs. Sparse network data representation
Dense vs. Sparse network data representation
Dense network data
Dense network data
The sampling locations which are distributed all over the Member States'territories, are referred to as the “dense network”.
The dense network results are presented on a map (with the exception of surface water as this sample type does not allow for geographical presentation) and in tabular form. The graphical representation illustrates the annual average radioactivity concentrations for each geographical region. Four shades are used to indicate the concentrations on a scale ranging from less than the reporting level to ten times the reporting level. In addition, each sampling location is illustrated.
An example of the results in airborne particulates sample type presented graphically: 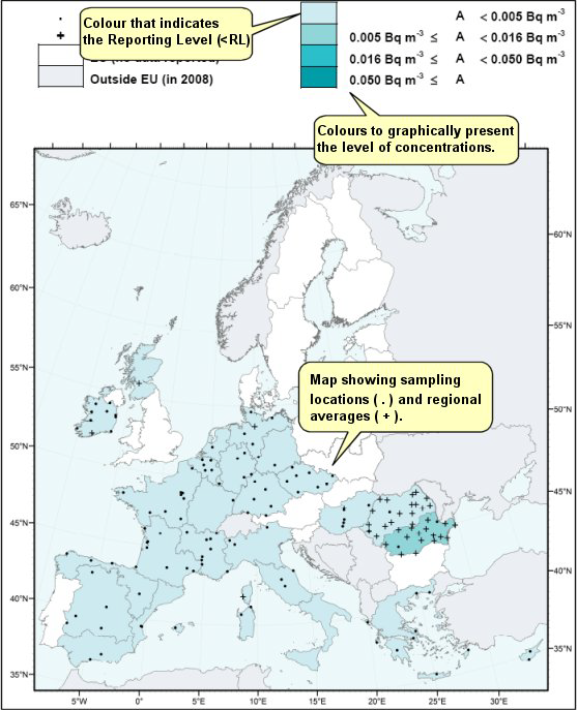
and the corresponding results presented in tabular form: 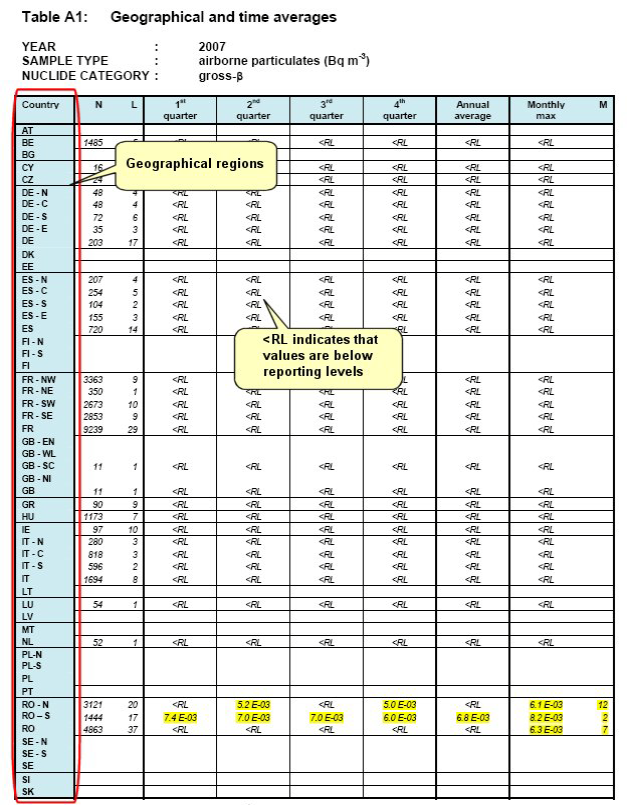
These results are averaged over geographical regions and over a particular time period (quarter, semester or whole year, depending on the availability of data). The total number of sampling locations (column L) and the number of measurements (column N) used to calculate the annual averages are given for each geographical region. In addition, the monthly maximum (column Monthly max) and the month (column M) in which this occurred are given for those values above the appropriate reporting level.
Sparse network data
Sparse network data
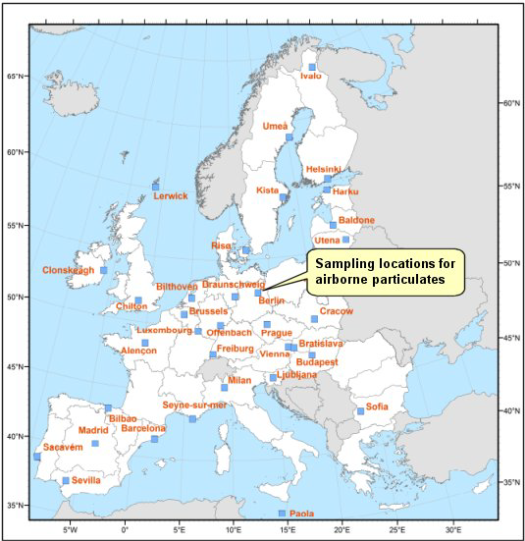
Actual concentrations are presented for a number of representative locations that were selected to this purpose. This is referred to as the “sparse network”. High-sensitivity measurements are performed at these locations and the individual results are presented graphically. The results for the sparse network are preceded by a map illustrating the sampling locations. The data are presented as time versus activity concentration graphs from 1984 onwards (where the data are available).
The following figure shows an example of a map with sampling locations for airborne particulates in the sparse network:
The following graph shows an example of activity trends for Be-7 in airborne particulates for the sparse network: 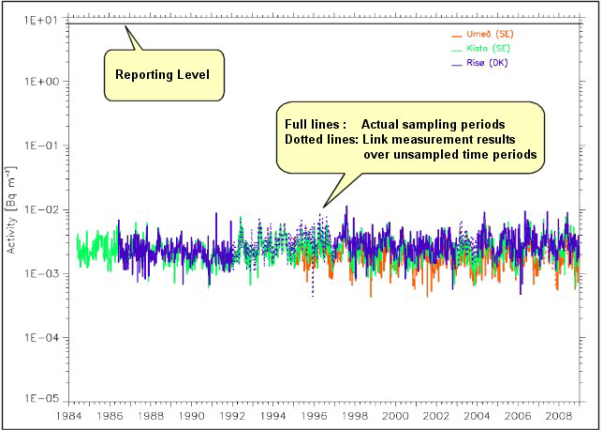
The choice of 1984 as a start date enables the pulse of radioactivity which entered the environment of the EU from the 1986 Chernobyl accident in the Ukraine to be seen clearly.
Participants
Authorities of all European Member States provide data to the REM group on an annual basis for checking and storing in REMdb.
Download page
The list of all the published (and downloadable) monitoring reports is available here.